 |
||||
|
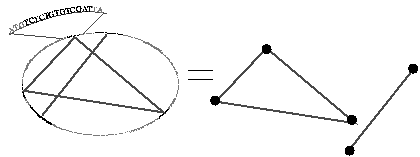
AGCTTTTCATTCTGACTGCAACGGGCAATATGTCTCTGTGTCGATTAAAAAAAG
Construction of a graph from the DNA sequence given above Every plant, animal, bacteria and fungus has a DNA sequence composed of four different bases called nucleotides. These nucleotides, Adenine (A), Cytosine (C), Guanine (G) and Thymine (T), are wrapped up in the famous Watson-Crick double helix. To describe a DNA sequence we list the sequence of nucleotides, as above.
Francis Clark is a PhD student with Kevin Burrage in the Maths Department at the University of Queensland. Working closely with biologists they are using graph theory to classify similarities in DNA subsequences. A graph is a set of nodes and edges which connect some of the pairs of nodes. Francis took a DNA sequence, represented subsequences as nodes and joined similar subsequences, or nodes, by edges. So the section of DNA sequence given above can be thought of as an ellipse where the triangle indicates the presence of three similar subsequences and a line another two similar subsequences. The graphs constructed for bacterial genomes (4-6 million nucleotides) are complex with hundreds of thousands of nodes and edges, and are too big to usefully project onto a two dimensional page. So Francis refined his model to comprise smaller disconnected subgraphs. In this way a subgraph may represent subsequences for a particular known (or unknown) biological function, such as a site where a particular protein can bind to. Perhaps, in the future, graph theory can unlock the secrets of those parts of our genome historically thought of as ‘junk’ , so the complex workings of DNA can be understood. |
||||
 |